Below is a selection of infographic designs developed for clients in healthcare, biotechnology, and the pharmaceutical industry. Each project reflects a thoughtful balance of content strategy, scientific accuracy, and visual clarity—designed to engage audiences while simplifying complex concepts.
Featured Infographic Project
GRIN Therapeutics
Mechanism of ACTION INFOGRAPHIC
DESIGN CHALLENGE / SOLUTION / OUTCOME
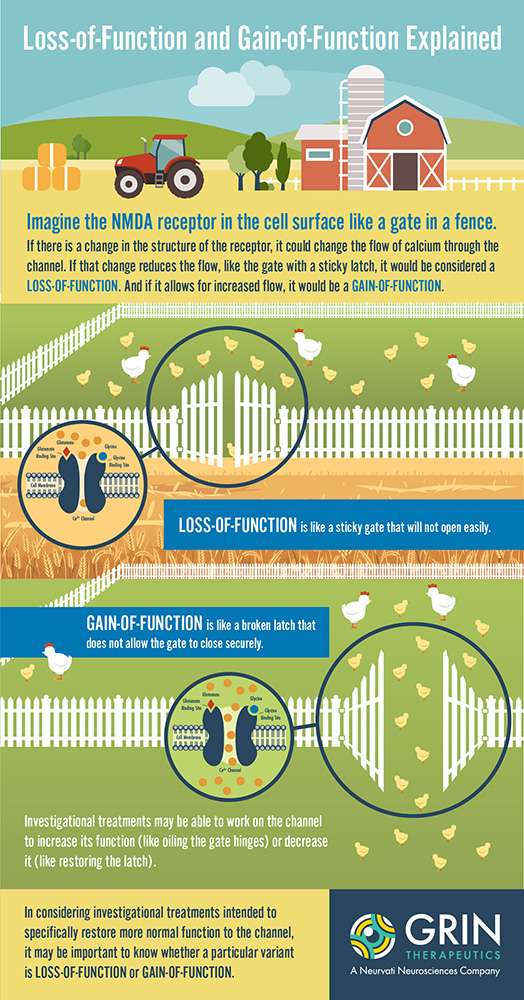
GRIN Therapeutics presented with the challenge of visualizing a complex mechanism of action (MOA) involving Loss-of-Function and Gain-of-Function in NMDA receptors on the cell surface membrane. The client proposed using a farm analogy—where chicks represent calcium and a faulty gate controls their movement—to illustrate the imbalance in calcium regulation. I translated this concept into a clear, engaging infographic that visually explains how a sticky gate (Loss-of-Function) limits calcium flow, while a broken gate (Gain-of-Function) allows excess flow, helping make a highly technical concept more accessible.
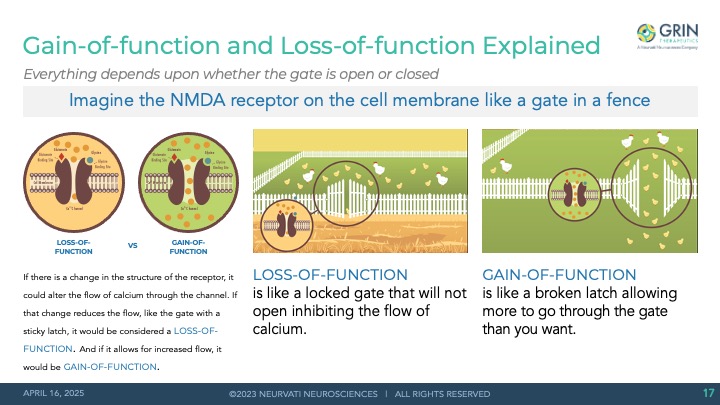
The client was pleased with the outcome and later asked to translate the infographic into simplified landscape version that could be used in a PowerPoint presentation.


